Chromoexcel by EGTC
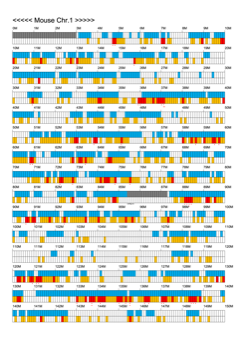
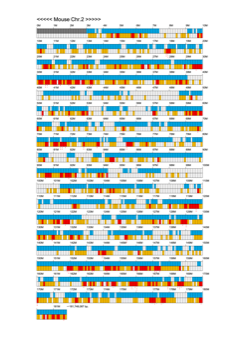
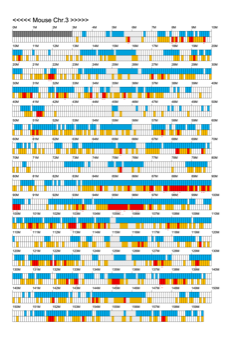
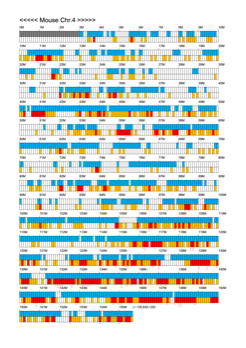
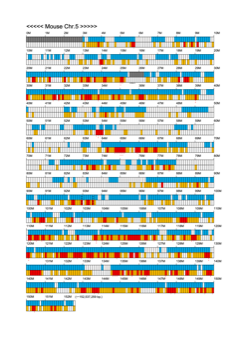
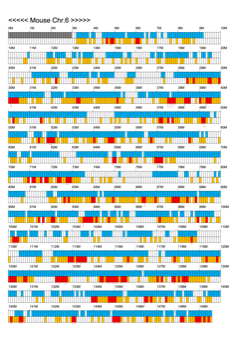
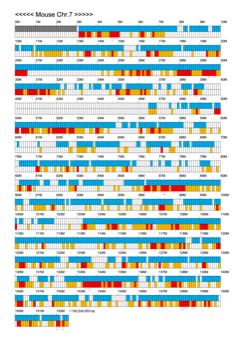
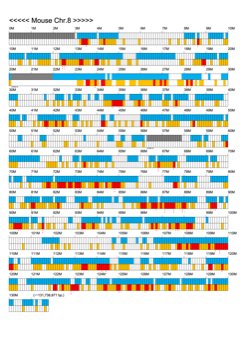
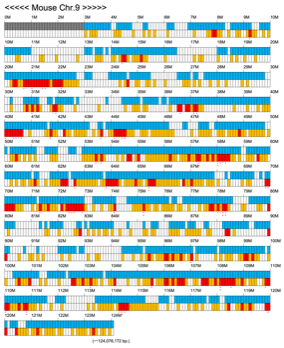
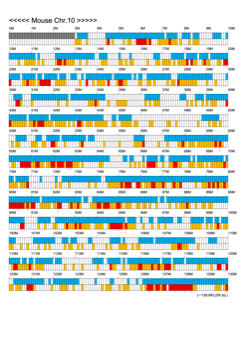
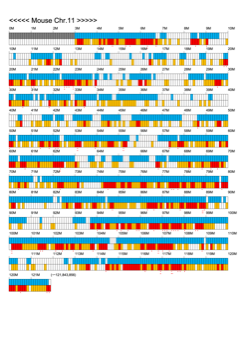
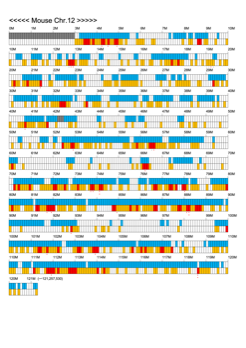
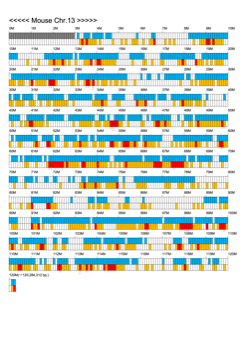
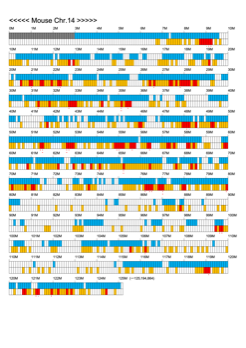
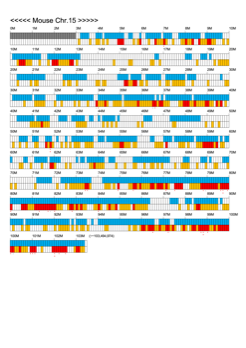
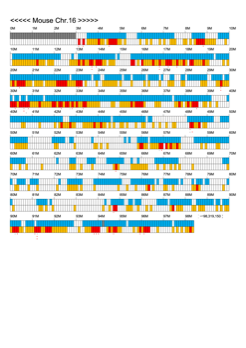
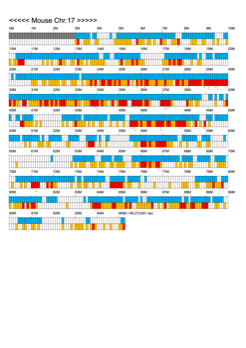
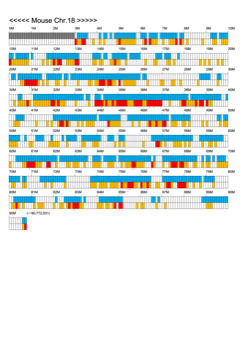
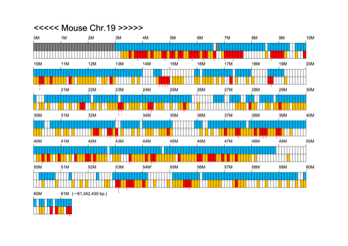
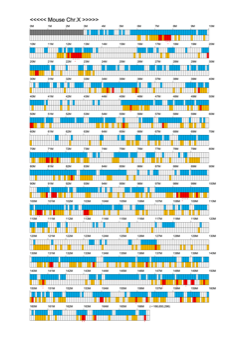
Using the Mouse Genome Browser, the chromoexcel represents the number of genes and gene trap clones for every 100 kbp of chromosome. If there is even one gene, it is light blue; if not, it is colorless. Gaps (locations with no nucleotide sequence information) are shown in gray. Trap clones are colorless if there are no clones, orange if there are 1 to 19 clones, and red if there are 20 or more clones. Regions with genes but no gene trap clones indicate that the gene is not working in the ES cells. Conversely, a region with no genes but many gene trap clones suggest the presence of a gene or gene-like substance that we do not yet know about. See "About" for a detailed explanation.