Chromoexcel
Chromoexcel is a diagram that uses Excel art to show where genes are and where they are not on mouse chromosomes. It also shows the distribution of the gene trap clones we are studying. A gene trap is a method of capturing genes that are active (expressed) in embryonic stem cells (ES cells) using mouse ES cells.
Chromosomes are thread-like structures found in the nucleus of cells that make up our bodies. They contain genetic information inherited from our parents. In humans, there are 22 pairs (44 chromosomes) of autosomes numbered from 1 to 22, plus sex chromosomes (XY in males and XX in females), for a total of 46 chromosomes. In mice, there are 19 pairs (38 chromosomes) of autosomes numbered from 1 to 19, so they have a total of 40 chromosomes, including the two sex chromosomes.
Genetic information is encoded in DNA, a substance that makes up chromosomes, using four letters: A, G, C, and T. In mice, the longest chromosome (Chr. 1) contains approximately 200 million letters, and all 40 chromosomes contain a total of approximately 6 billion letters of A, G, C, and T.
Our bodies are composed primarily of a substance called protein. The part of genetic information that contains the design information for proteins is called a gene. Genetic information written in DNA is copied into a substance similar to DNA called RNA. This process is called transcription. RNA uses four letters: A, G, C, and U. The ‘T’ in DNA is replaced with ‘U’ when transcribed into RNA. Based on the protein design information copied into RNA, proteins are synthesized. This event is called translation. In other words, RNA is produced based on the genetic information encoded in DNA, and proteins are synthesized based on the information in this RNA. However, some genes contain information for RNA that does not produce proteins. Recent research has revealed that in such cases, the RNA itself plays important roles (functions) within living organisms.
The number of genes that contain information about proteins and RNA is estimated to be around 50,000 in humans and mice. However, these 50,000 genes are not evenly distributed across the chromosomes. There are areas where genes are clustered together, and there are also areas where there are no genes at all. Chromoexcel shows the degree of variation in the distribution of genes.
Now, let's talk about gene traps for a while. To do so, we need to explain genes in a little more detail.
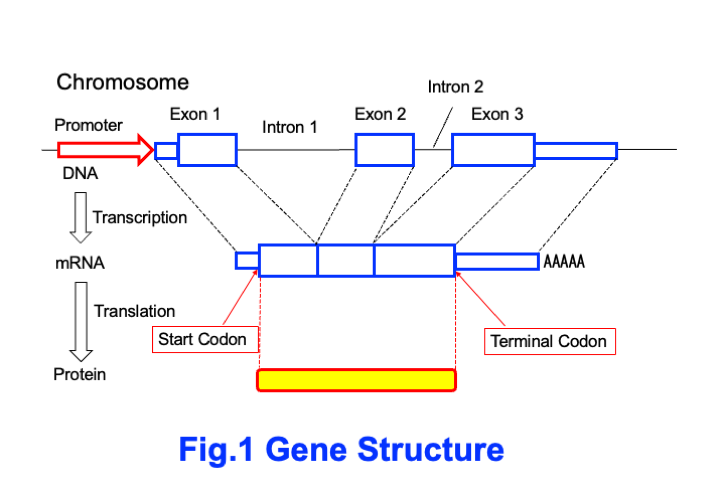
In fact, genes are not necessarily written as a single block of information consisting of A, G, C, and T. There are often extra A, G, C, and T between the important parts that become RNA. In fact, this is more common. Please look at Figure 1. RNA that contains protein information is called messenger RNA (mRNA). Genetic information is written in DNA and RNA using four letters: A, G, C, and T (U). Proteins are composed of 20 types of amino acids. Three letters of RNA represent one amino acid. These three letters of RNA are called ‘codons.’ The code table used to translate the genetic information written in RNA into proteins is called the codon table (Figure 2). For example, if the first letter is A, the second letter is U, and the third letter is G, the codon AUG means the amino acid methionine (Met). However, this AUG is also called the ‘start codon’ and means that translation begins from this point in the RNA information. There is also a codon that signifies the end of translation. This is called the stop codon (terminal codon). Figure 1 shows how information from the start codon to the stop codon of mRNA is translated into proteins.
Furthermore, the DNA of chromosomes contains regions that contain mRNA information and regions that do not. The regions that contain mRNA information are called ‘exons.’ Genes may consist of a single exon, but most are composed of two or more exons. The regions between two exons are called ‘introns.’ Figure 1 shows a gene with three exons and two introns.
And in genes, there is an area called a ‘promoter’ at the beginning of each gene. Promoters act as engines for transcribing mRNA. Without promoters, transcription into mRNA cannot occur. Furthermore, the promoter contains information about where and when the gene will be expressed. For example, it may contain information that the gene will be expressed in brain cells after birth. Genes are determined by the function of the promoter to express themselves in specific cells. You can actually investigate this.
Reporter genes are used for this purpose. The most famous reporter is GFP (Green Fluorescent Protein) found in jellyfish. When the promoter region of a gene that works in muscles is taken and connected to the GFP gene, muscle cells glow green. When the promoter region of a gene that works in the brain is connected to the GFP gene, the brain glows green. In other words, the promoter region is like an engine with a computer.
Now, let's talk about gene traps. Please refer to Figure 3. In gene trapping, a tool called a trap vector is used. The trap vector contains a reporter gene. This reporter gene does not have a promoter (engine). This trap vector is introduced into the chromosomes of mouse ES cells. Since it does not have a promoter, nothing happens even if it is inserted into an empty region of the chromosome. When it is inserted downstream of a gene promoter, the promoter activates the reporter gene, producing mRNA, which is then translated into the reporter protein. The reporter protein incorporated into the trap vector has a property that makes it resistant to the antibiotic G418. The original ES cells cannot proliferate in a culture medium containing the antibiotic G418. However, when the trap vector enters a gene and the reporter gene is activated (expressed), the cells can proliferate even in a medium containing G418.
The clusters of proliferated ES cells are called colonies. These colonies can be picked up, separated, and proliferated again. The group of cells with the same genetic composition produced in this way is called a clone. In a gene trap experiment, if 100 colonies are formed in a single experiment, 100 trap clones can be created. By using a reporter gene, genes that are active in ES cells are captured (trapped), but at the same time, the function of those genes is stopped (destroyed, knocked out).
We have further developed this gene trap method to construct an ‘exchangeable gene trap system’ (Fig. 4). Variable type refers to a technique that allows genes that have been trapped to be freely modified at a later stage. The explanation of this technique will be omitted here.
Mouse ES cells are also known as pluripotent cells. This is because mouse individuals can be created from these ES cells. Chimeric mice are created from ES cells. A chimera refers to an individual composed of two or more types of cells with different genetic compositions. By mating these chimeric mice with wild-type mice, it is possible to create a group of mice (strain, mouse line) with the same genetic composition. Using trap mice, we can investigate what functions the trapped genes, i.e., the knocked-out genes, perform in living organisms.
We are making the information on trap clones produced by the exchangeable gene trap method available worldwide through the EGTC (Database for the Exchangeable Gene Trap Clones)(Fig. 5). Information on 1,278 clones as ES cells is available (Fig. 6). We have determined the chromosomal locations of the trapped genes in 1,170 clones. Additionally, 1,158 clones (90.6%) trapped known genes (genes with names), but 40 clones (3.1%) contained only gene fragments suspected to be part of mRNA called ESTs (Expressed Sequence Tags) at the location where the trap vector was inserted, and 80 clones (6.3%) had the trap vector inserted into locations where nothing was present. These are provisionally referred to as ‘New’ (novel genes). We are currently analysing these trap clones that cannot be classified into either EST or New.
In addition, chimeric mice were created from the 514 clone, and a mouse line was established and deposited in the mouse bank established by the Resource Development Division, Centre for Life Resource Research and Support, Kumamoto University, under the name CARD R-BASE.
There is a database maintained by the International Gene Trap Consortium (IGTC), which collects information on research facilities conducting large-scale gene trapping around the world, and EGTC is also included in this database (Figure 7). Currently, there are 121,703 clones registered as ES cells in the IGTC.
The collection of all genetic information contained in the nucleus of an organism is called a genome. In humans, it is called the human genome, and in mice, it is called the mouse genome. One of these databases, UCSC Genome Browser on Mouse July 2007 (NCBI/mm9) Assembly (Figure 8), also contains information on IGTC gene trap clones. We also use this database when analyzing the location of EGTC clone trap vectors.
Figure 8 shows three EGTC clones (Ayu21-W214, Ayu21-18, Ayu21-T516) that have trapped the Bnc2 (Basonuclin 2) gene. This figure shows an enlarged view of the middle region of mouse chromosome 4 (419,073 bp). A scale bar indicating 100 kbp is also displayed. ‘bp’ is an abbreviation for base pair, which represents the number of A, G, T, and C. “kbp” is an abbreviation for 1,000 bp. Therefore, 419,073 bp is approximately 419 kbp.
Figure 9 shows the number of trap vectors in EGTC and IGTC trap clones, indicating which chromosomes have the most and least trap vectors. In addition, the distribution of known genes (RefSeq) is shown. Genes (green) are most abundant on chromosome 7, but trap clones (blue and red) are most abundant on chromosomes 2, 4, and 11.
Chromoexcel provides a more detailed view of the distribution of trap clones and genes. We are using a technique called Excel art. Figure 10 shows how it is created. Excel is a spreadsheet software, and pictures drawn using Excel are called Excel art.
Using the mouse genome browser shown in Figure 8, we will investigate the number of genes and trap clones every 100 kbp from the ends of the chromosomes. If there is at least one gene, it is colored light blue; if there are none, it is uncolored. Additionally, the region from the centromere-side end (0M) of each chromosome to 3 Mbp (3,000,000 bp) is an unsequenced area called a ‘gap.’ This portion is colored grey.
Next, if there are no trap clones, the color is white; if there are 1 to 19 trap clones, the color is orange; and if there are 20 or more trap clones, the color is red. Both genes and trap clones are analyzed using a 100 kbp region arranged in one row by three columns.
Figure 10 shows the Chromoexcel of chromosome 19, the shortest chromosome in the mouse genome. An enlarged view at 7 M is also included. The red circles indicate regions where there are no genes but more than 20 trap clones have accumulated (TCAA: Trap Clone Accumulated Area).
When looking at Chromoexcel, you will notice that there are quite a few areas where genes are completely absent (gene deserts) across a wide range. Conversely, you will also notice that there are quite a few areas where genes are present but there are no gene trap clones. Gene traps are a method for capturing genes that are active (expressed) in ES cells, so areas where genes are present but there are no gene trap clones suggest that those genes are not active in ES cells. Conversely, regions where genes are absent but numerous gene trap clones exist suggest the presence of genes or gene-like entities that we have not yet identified.